What the Instagram Professional Dashboard is, what every metric means (including "views in the last 30 days"), how to access monetization tools, and the 2026 updates.
.avif)
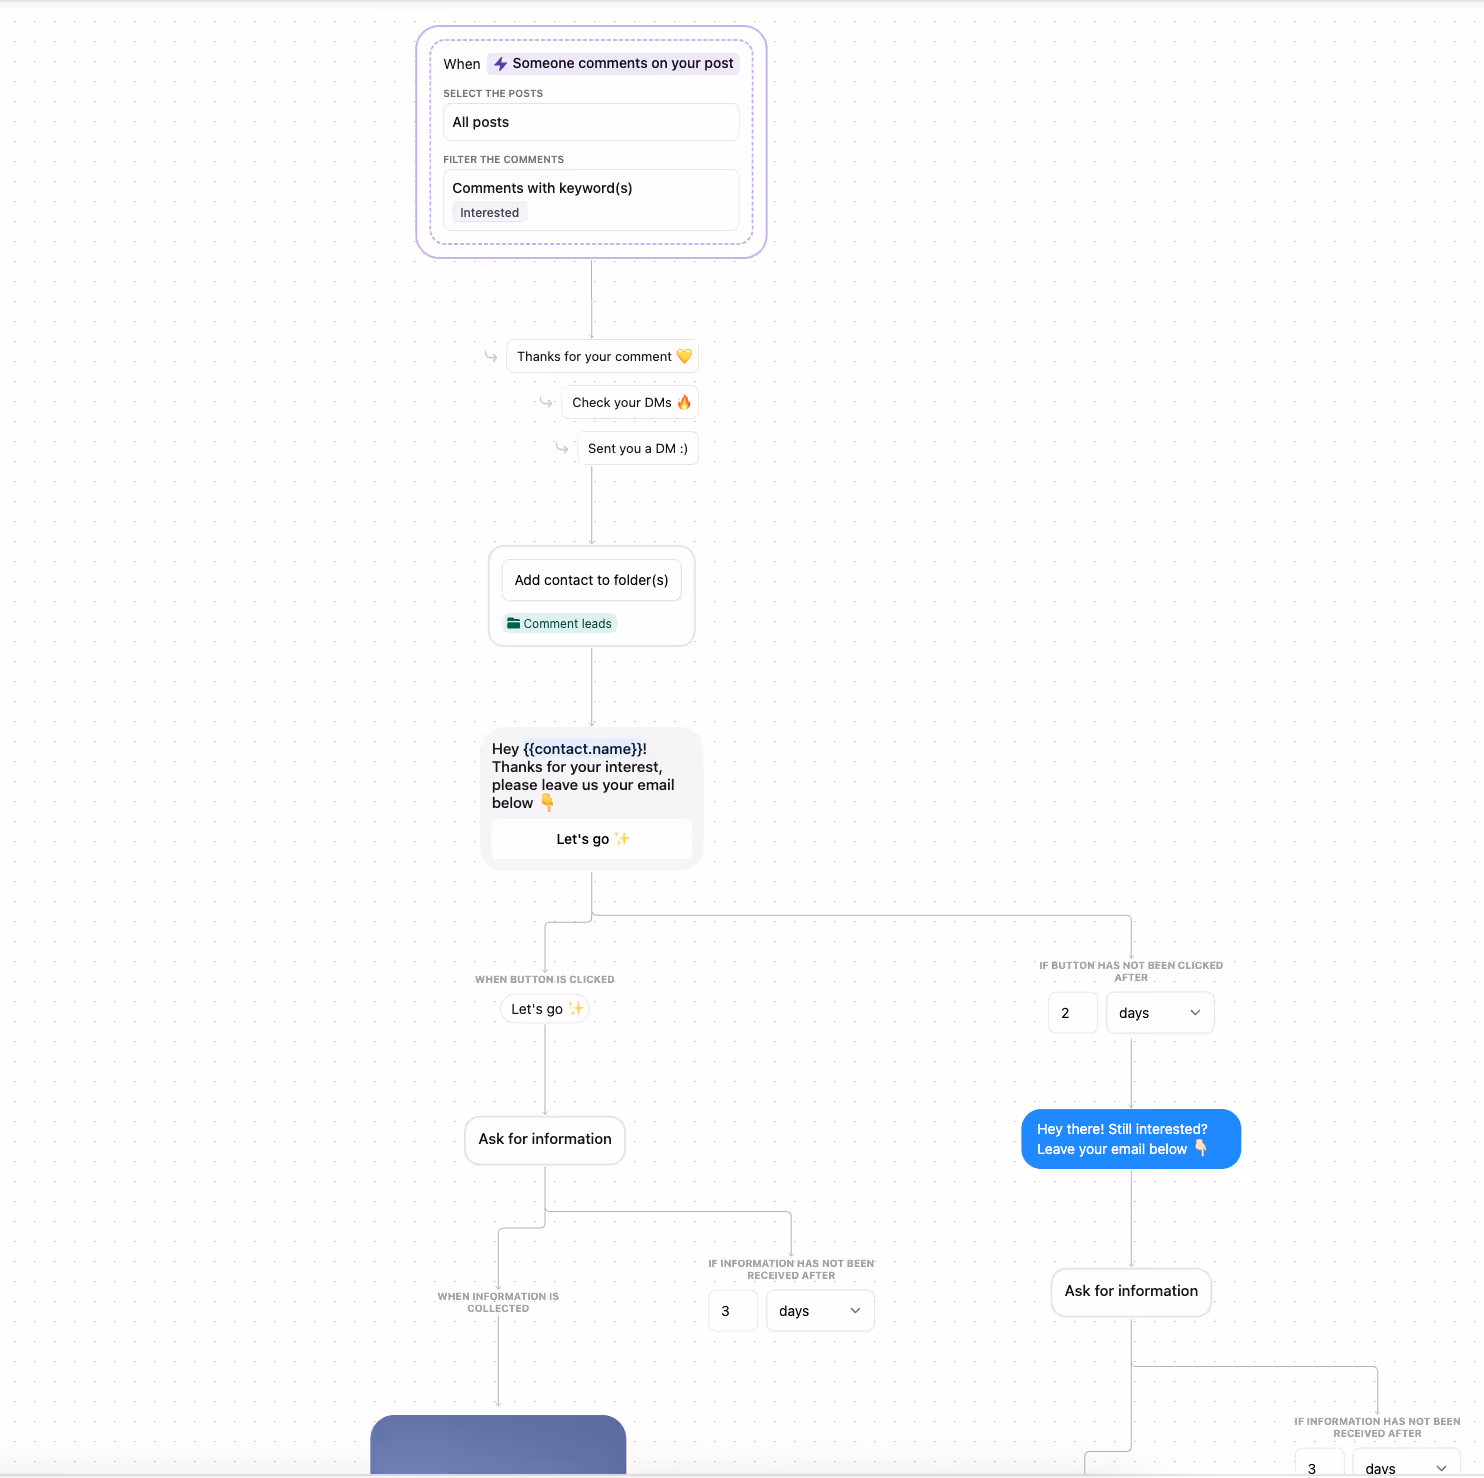
Automate Comments and DMs in 5 Minutes
Someone comments on your IG post. They get a DM instantly. You do nothing.

Trusted by 10K+ creators and SMBs


TL;DR
TL;DR
Your dashboard tells you what's working. Inrō captures every lead it generates.
Turn comment spikes from your top-performing Reels into automated DM conversations.
The Instagram Professional Dashboard is a built-in control center available on every Creator and Business account. It's a single screen that gives you access to your performance data, growth tools, monetization features, and educational resources — all in one place.
If you've switched to a Creator or Business account, the dashboard is already enabled. You'll find it under your bio on your profile page as a button labeled "Professional dashboard" or "View professional dashboard."
Who has access to the Professional Dashboard:
What the dashboard contains:
The Professional Dashboard groups every professional tool into four main areas:
In plain language:
The feed and Stories are what your audience sees. The Professional Dashboard is what you see — your analytics, your monetization eligibility, your campaign tools, and your performance history.
.avif)
The dashboard's opening view shows one number prominently: your total content views for the selected period. Below it is a daily bar chart. Neither of these is where the useful information lives.
The actionable data is one layer deeper, inside the full Insights view. To get there, tap "See all insights" from the dashboard. From there you are looking for four relationships:
Views vs Accounts Reached: if views are high but reached is low, your content is being rewatched by the same people. If both are low, it is not being distributed. If reached is growing faster than views, you are finding new audiences.
Engaged vs Reached: divide accounts engaged by accounts reached. This is your real engagement rate — how many people who saw your content cared enough to act. A rate above 5% on Reels is strong.
Content type breakdown: which format (Reels, Posts, Stories) is producing the highest engaged-to-reached ratio? That format gets more production budget.
Profile actions: website taps and DM initiations. If these are growing while views stay flat, your existing audience is warming. If views are growing but these stay flat, you are reaching people who are not yet converting.
When you look at your profile, the Professional Dashboard button shows a preview number — something like "5,200 views in the last 30 days."
This is your total content views for the selected time period. "Last 30 days" is the default date range Instagram sets when displaying your performance summary. It is a genuine content performance metric — showing how many times your posts, Reels, and Stories were viewed across the past 30 days.
The "last 30 days" is a date range, not a fixed label. When you open the full Insights view inside the dashboard, you can change this window to 7 days, 28 days, or a custom range. The preview number under your bio reflects whatever the current selected period shows.
What "views" specifically means here:
Since April 2025, Instagram replaced "Impressions" as its primary metric with "Views." Views counts every time your content is seen or played — including repeat views from the same person. If someone watches your Reel three times, that counts as three views. This is the same logic as the old Impressions metric, just renamed and unified across all content types.
The key distinctions:
For most creators, views is the headline number and accounts reached is the more meaningful quality signal — reached tells you how many distinct people you're actually getting in front of.
If your dashboard looks different from articles written before mid-2025, it's because Instagram made a significant change in April 2025: it retired "Impressions" and "Plays" as standalone metrics and replaced them with a unified "Views" metric across all content types.
What changed:
What stayed the same:
Why this matters when reading your dashboard:
If you're comparing current data to data from before April 2025, views figures may not be directly comparable to your old impressions numbers — the counting methodology changed. For accurate trend analysis, use date ranges that sit entirely within the post-April 2025 window.
The redesigned Insights tab. The Insights section now has three dedicated tabs (Overview, Engagement, Audience) instead of a single scrolling page. Share rate and skip rate are now surfaced more prominently. For the full breakdown, see our Instagram Insights update guide.
Competitive Insights restricted to Meta Verified. Originally available to all Professional accounts, this feature (compare up to 10 accounts) now requires a Meta Verified subscription. If you previously had access and it disappeared, this is why.
Some tools opened to all public accounts. Content scheduling, trending audio access, and basic insights previews opened to all public accounts in 2026 — even Personal account types. Full Insights still requires Creator or Business.
New monetization eligibility surfaces. The Monetization section now shows clearer eligibility status for affiliate programs, subscriptions, and bonus programs as they roll out by region.
Shareable Insights PDF export. Performance data can now be exported as a PDF directly from the Edits app — useful for creator-brand media kits.
You need a Business or Creator account.
On mobile:
The core of the dashboard. You'll see:
Inside full Insights, focus on views, accounts reached, accounts engaged, follower growth, and content performance split by type.
Note: Instagram stores up to 90 days of analytics. Export or log key metrics monthly for longer-term trend tracking.
Tools for running your account professionally: promotions and ads, branded content approvals, shopping setup, saved replies for DMs, and monetization status and eligibility. The saved replies feature is worth setting up if you get regular DMs — it keeps your inbox organised and your response time fast.
Instagram tips, trend breakdowns, and feature update articles from @instagram and @instagramforbusiness. Useful for catching new analytics features or policy changes early.
Compare your account against up to 10 similar profiles on reach, engagement, and posting frequency. Now restricted to Meta Verified subscribers. If the feature isn't in your dashboard, a Meta Verified subscription will unlock it.
The monetization section expanded significantly in 2026. Here's what's currently available.
How to check your eligibility: Inside the Professional Dashboard, scroll to Grow your business and tap Monetization. Eligibility depends on account type, follower count, content compliance with Meta's Partner Monetization Policies, and region.
Your headline content metric since April 2025. Total times your content was seen including repeat views. Use it to measure overall visibility and spot which content is getting distributed. If views spike on a specific Reel format, that's your signal to replicate it.
The quality companion to Views. Reached counts unique accounts — each person counted once regardless of how many times they viewed. High views with lower reached means content is being rewatched (positive). Low views and low reached means the algorithm isn't distributing it.
People who liked, commented, shared, saved, or DMed from your content. This is the closest native metric to a revenue signal. Track the ratio of accounts engaged to accounts reached — that's your true engagement rate.
Net growth, where followers live, and age and gender splits. If your offers are geo-specific or demographic-specific, this tells you whether you're attracting the right audience.
Performance split by Posts, Reels, Stories, and Lives. Look at average views per content type and average engagement per reach. In most accounts, Reels drive the most new views while Stories drive the most direct DMs and engagement. If Reels performance varies by length, see our Instagram Reels length guide for what works best in 2026.
Website taps, call taps, and DM initiations from your content. For many creators, these are the most commercially important numbers — the direct bridge between content and pipeline.
These are two distinct metrics, and both are high-value signals in 2026.
Shares tracks public reshares — when someone reposted your content to their own feed or Story.
Sends tracks private DM sends — when someone forwarded your content to another user directly.
They measure different behaviours and appear separately in your Insights. Mosseri has described Sends per Reach as one of the strongest algorithm signals in 2026, because a private DM send represents active personal recommendation rather than passive scrolling. If someone cares enough to send your content to a specific person, that is a high-quality engagement signal the algorithm weights heavily.
Available in the redesigned Engagement tab. Skip rate tells you when viewers scroll away from your Reels — critical for evaluating hook quality in the first 2-3 seconds. Share rate shows what percentage of viewers sent your content to someone else.
The views figure in your dashboard is your total content views, it goes up when the algorithm distributes your content more widely. The three levers that consistently increase it:
Instagram's algorithm identifies content worth distributing based on skip rate. If most viewers scroll past within 2 seconds, distribution stops. A strong opening frame, a surprising visual, a direct question, a bold text statement, reduces skip rate and signals to the algorithm that the content is worth pushing further.
When someone DMs your content to another person, Instagram treats it as a high-quality endorsement and extends distribution. Content that is genuinely useful or surprising enough that viewers share it privately is the format that compounds over time.
The algorithm establishes a baseline expectation for your account. Posting in your highest-performing format 3 to 4 times per week gives it more data to distribute, rather than occasional posts in varying formats.
Inside the Professional Dashboard, open Insights and sort your Reels by accounts engaged. Note the top three to five — by the ratio of engagement to reach, not raw views. These are your highest-intent content formats.
Look for patterns: What topic do they address? What hook style in the first two seconds? What format (talking head, text overlay, tutorial)?
Add an explicit keyword CTA to your top-performing Reel formats. The CTA should deliver something specific and relevant to the content.
Examples:
The keyword should be one word, relevant to the content, and something the viewer would naturally type if genuinely interested.
With Inrō connected:
Every person who comments the keyword — today or six months from now if the Reel keeps generating views — automatically receives your resource and gets added to your tagged CRM.
For the complete setup, see our comment-to-DM automation guide.
When you launch a new offer, you already have a warm segment of people who previously engaged with the same topic. A targeted DM campaign to that segment consistently outperforms a full broadcast.
Your dashboard identifies what content to scale. Inrō ensures the people who engage don't disappear into a follower count.
Inrō turns every keyword comment into an automatic DM conversation, while your dashboard keeps tracking the results.


A built-in control center on Instagram for Creator and Business accounts. It groups your performance analytics, monetization tools, growth resources, and educational content into one place, accessible from your profile.
It shows your total content views for the selected 30-day period — the number of times your posts, Reels, and Stories were seen over that window. "Last 30 days" is the default date range for your data review. You can change the time window inside full Insights. It is a genuine content performance metric.
Views counts every time your content is seen including repeats by the same person. Accounts Reached counts unique accounts only — each person once. Views gives you total visibility. Reached gives you your actual audience size. Both matter.
In April 2025, Instagram unified its primary content metric by retiring both "Impressions" (posts) and "Plays" (videos) in favour of a single "Views" metric across all content types. This simplifies cross-format performance comparison and makes total content visibility easier to track.
The Professional Dashboard is the main screen with a high-level summary and links to tools. Insights is the detailed analytics area inside it showing views, reach, engagement, and individual content performance. Think of the dashboard as the home screen and Insights as the data layer inside it.
No. Instagram does not show individual profile visitors. The dashboard shows aggregate data — total profile visits, website taps, contact taps — but not the specific accounts behind those actions.
The views number shown in the dashboard preview is your content views — you increase it by creating content the algorithm distributes broadly. Focus on strong hooks in your Reels (skip rate), content people share privately, and posting consistently in your top-performing format.
Up to 90 days. For data beyond 90 days, export metrics manually or use a third-party analytics tool that stores historical data.
Yes. Log in at instagram.com, look at the left sidebar, and click Dashboard.
Most likely your account is still on Personal type. Switch in Settings → Account type and tools. Allow up to 24 hours for full Insights data to populate after switching.
Branded Content, Subscriptions, Gifts on Reels, the Affiliate program (1,000+ followers required), Shop integration, and Bonuses when active. Check eligibility in the Monetization section under Grow your business.
A tool to compare your account against up to 10 similar accounts on reach, engagement, and posting frequency. Restricted to Meta Verified subscribers as of 2026.
Shares and Sends are two separate metrics. Shares counts public reshares of your content to other feeds or Stories. Sends counts private DM forwards — when someone sends your content directly to another user. Both are strong engagement signals. Sends per Reach is considered one of the most important algorithm signals in 2026 because a private send indicates high relevance and personal endorsement.
Generally yes. Numbers reflect real interactions with minor discrepancies that typically resolve within 24 hours. If a metric looks dramatically off, log out and back in, or check Meta's status page for known outages.
Both unlock the full Professional Dashboard with the same Insights and content metrics. Business accounts have more shopping and promotion tools. Creator accounts surface more creator-specific content and resources. Most individual creators should choose Creator; brands and businesses with shops should choose Business.
In some regions and language settings, Instagram abbreviates large numbers in the dashboard using "T" to mean trillions. If your dashboard shows "5.3T views," this means 5,3 trillion views.
Join automations strategies and Instagram Insights weekly
By entering your email address above and clicking Subcribe, you consent to receive marketing communications (such as newsletters, blog posts, event invitations and new product updates), and targeted advertising from Inrō from time to time. You can unsubscribe from our marketing emails at anytime by clinking on the "Unsubscribe" link at the bottom of our emails. For more information about how we process personal information and what right you have on this respect, please see our Privacy Policy.
Attract more leads, target them with DM marketing, and automate your interactions on Instagram!
.avif)
.avif)
.avif)