Forward taps, back taps, exits, next swipes, here's what every Instagram Navigation metric means and how to use them to improve your Stories.
Automate Comments and DMs in 5 Minutes
Someone comments on your IG post. They get a DM instantly. You do nothing.

Trusted by 10K+ creators and SMBs


TL;DR
TL;DR
👉 If you want to convert Story engagement into DMs, leads, or sales, Inrō automates it all. Start free today.
Turn Story Replies Into Leads Automatically
Someone replies to your Story. They get a DM instantly with your offer, freebie, or link. You set it up once.
If you’ve ever checked your Instagram Insights and asked yourself, “What does navigation mean on Instagram?”, you’re not alone.
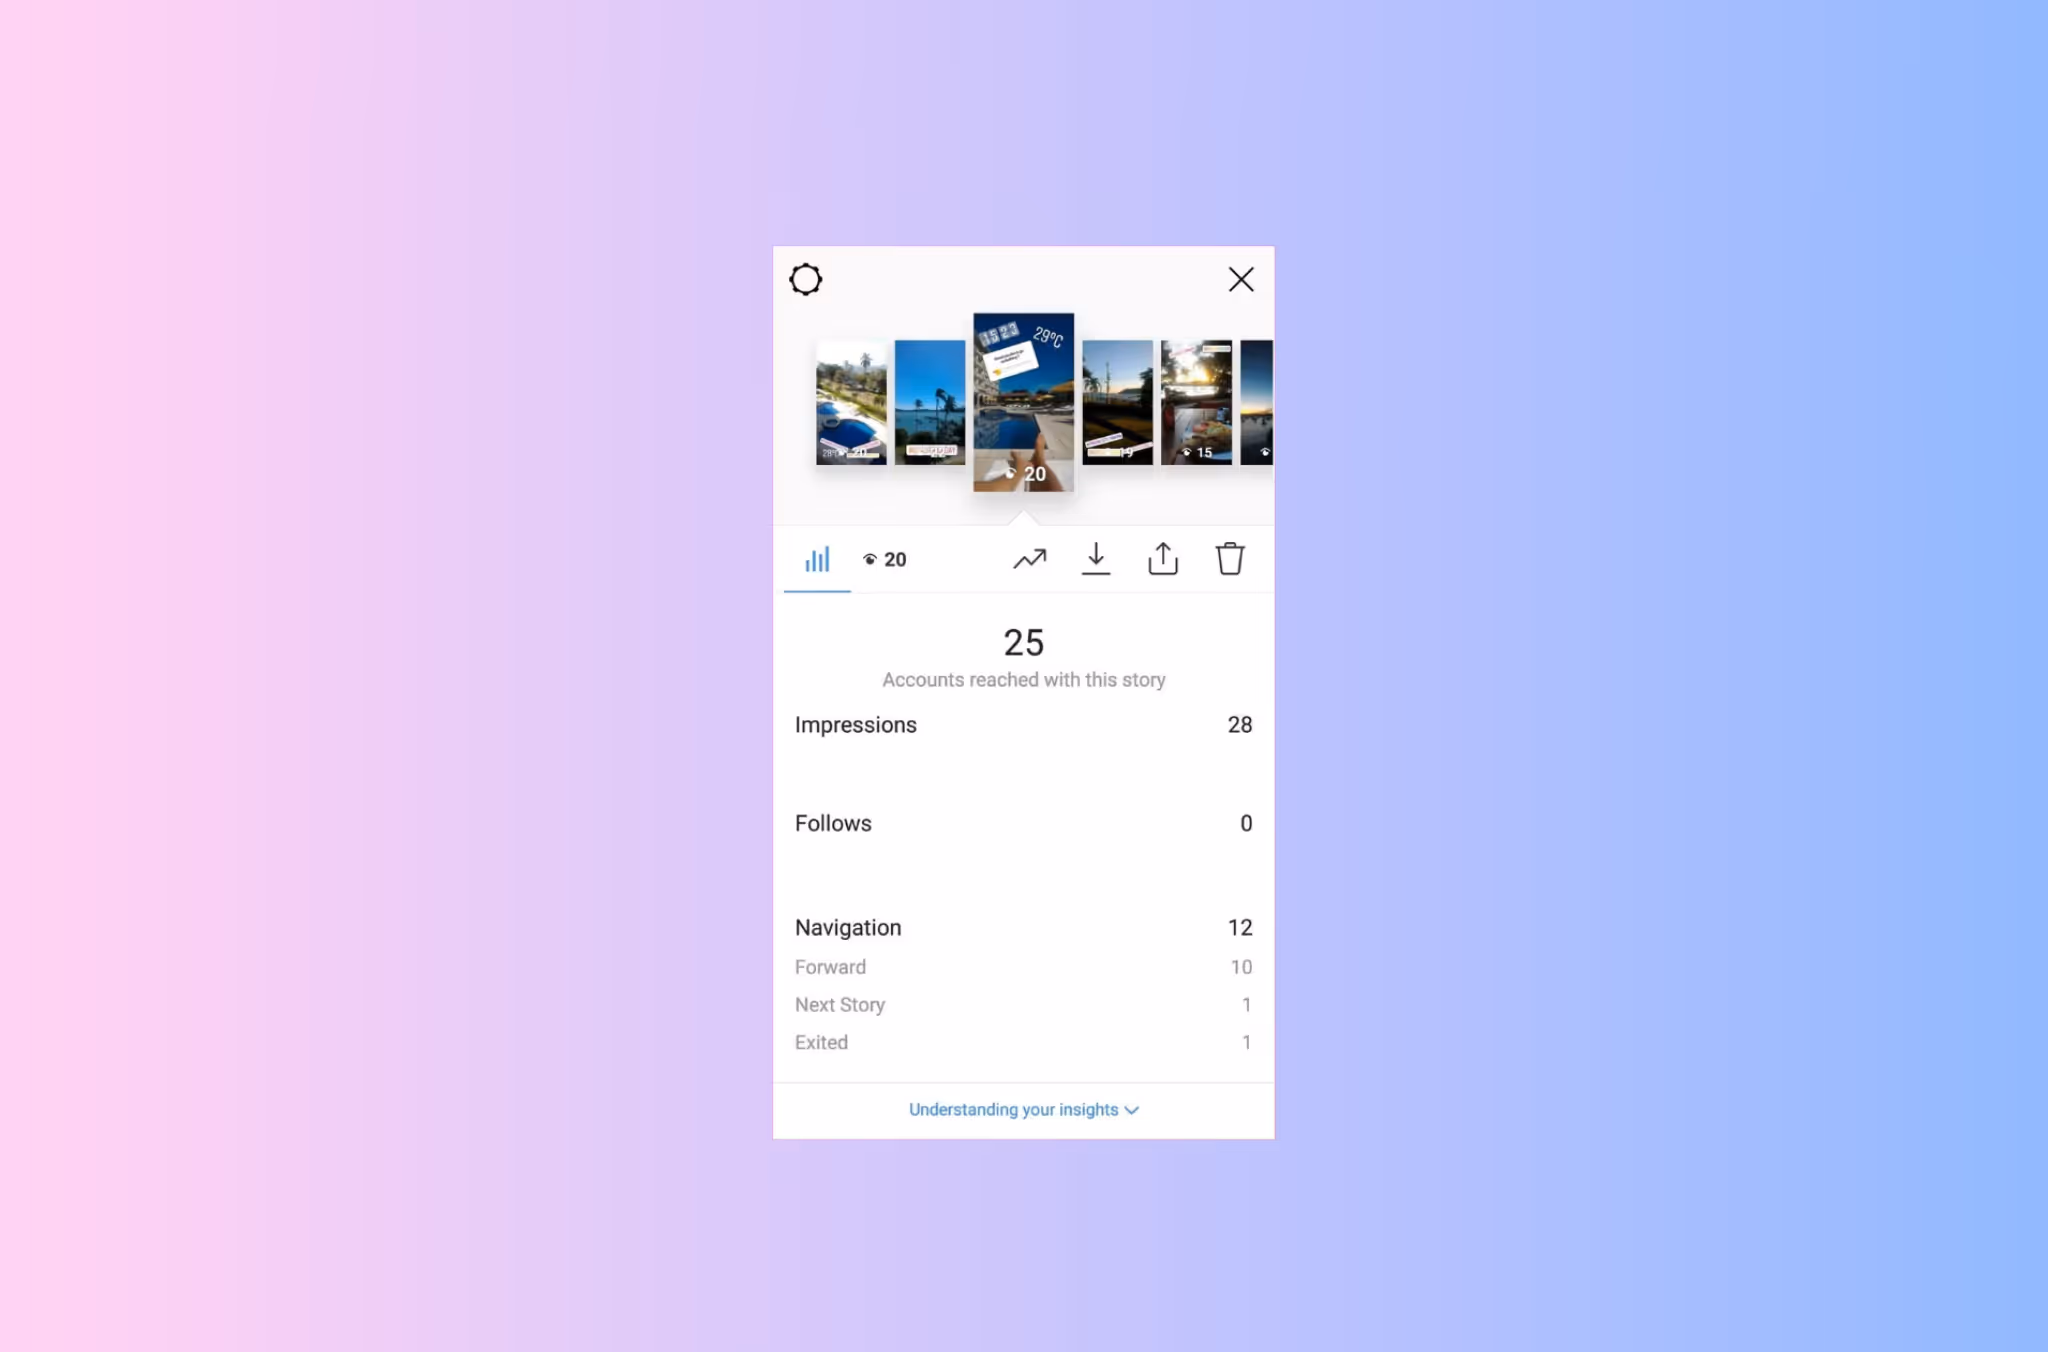
The Navigation tab in Instagram Insights shows how people move through your Stories: whether they tapped forward, went back, exited, or swiped to the next account. Understanding these metrics helps you figure out what’s engaging your audience and what’s making them leave.
In this guide, we’ll break down every Navigation metric, explain what it means for your content, and share tips to improve your Stories’ performance.
The Navigation section in Instagram Insights tells you how viewers interact with your Stories. It answers questions like:
In short: Navigation = how users move through your Stories.
This data helps you evaluate whether your Stories are interesting enough to hold attention or if they’re causing people to skip.
What it means: The number of times people tapped to move to the next Story slide in your sequence.
⚡ Tip: A high number here is normal, but if it’s extreme, your content might not be engaging.
What it means: The number of times viewers tapped left to rewatch the previous Story.
⚡ Tip: Treat high back taps as a positive signal. Analyze what made people go back (hooks, humor, aesthetics).
What it means: When users swipe to another account’s Story instead of staying with yours.
⚡ Tip: If one specific Story gets a lot of next swipes, that’s a sign to rethink the content format.
What it means: The number of times users left Stories completely.
⚡ Tip: Check if your Story was too long, confusing, or irrelevant.
Each navigation action reveals something specific about where a viewer's head is at. Understanding intent behind the tap is more useful than just counting the numbers.
Usually mean one of three things: the content felt too slow, too familiar, or too long. If your Story slide has no hook in the first second, viewers tap through before they register what they're looking at. This is not always bad, in a multi-slide sequence, some forward taps are expected. The issue is when they happen on your first or second slide before you've had a chance to deliver value.
Are the strongest positive signal in Instagram Stories analytics. A viewer consciously chose to go back. That means something caught their attention: a detail they missed, a visual that surprised them, a piece of information they wanted to read again. When you see back taps on a specific slide, study that slide. Replicate whatever made it worth a second look.
Signal that your content did not earn the next moment. The viewer was in Stories mode, ready to consume, and chose a different account instead of continuing with yours. This is the metric to take most seriously when diagnosing underperforming content.
Are the most neutral of the four. Every viewer exits eventually. The question is whether exits cluster on a specific slide, if slide 4 of 6 shows a spike in exits, that slide is breaking the sequence. Fix the transition or cut the slide entirely.
The pattern to look for across all four: If you see high forward taps early and high exits at the end, your Story is losing people at both ends. That means your hook and your closer both need work. If you see high back taps in the middle, you have one strong slide surrounded by weaker ones. Use that middle slide as a template for everything around it.
Here’s how to use these metrics together:
Look for patterns across multiple Stories. For example, if every product Story gets skipped, but behind-the-scenes ones get rewatched, that’s your signal to adjust strategy.
High-quality visuals stand out. Use apps, editing tools, or even professional help to create content that feels polished and engaging.
Make sure your Stories match your audience’s interests. For brands, stay niche-specific but add variety to avoid monotony.
Watch what competitors are posting in Stories. Analyze formats, hooks, and engagement tricks you can adapt.
Use Insights to test hashtags, CTAs, and interactive stickers. Run A/B tests (with/without captions, polls, etc.) to optimize performance.
Don’t cut corners. Modern smartphones are enough, but better gear or unique content formats (like drone shots) can give you an edge.
Navigation metrics tell you which Stories hold attention. But attention without action is just a view. The next step is converting that engagement into conversations.
These are your best-performing pieces of content. Add a direct call to action to them: "Reply to this Story" or "DG me the word [X] for [offer]." Viewers who tapped back are already re-engaged, they are the most likely to respond.
If a slide has a high exit rate, consider testing it as a lead capture point instead. A simple "Before you go, send me a DM" sticker or a swipe-up link can recover viewers who were about to leave.
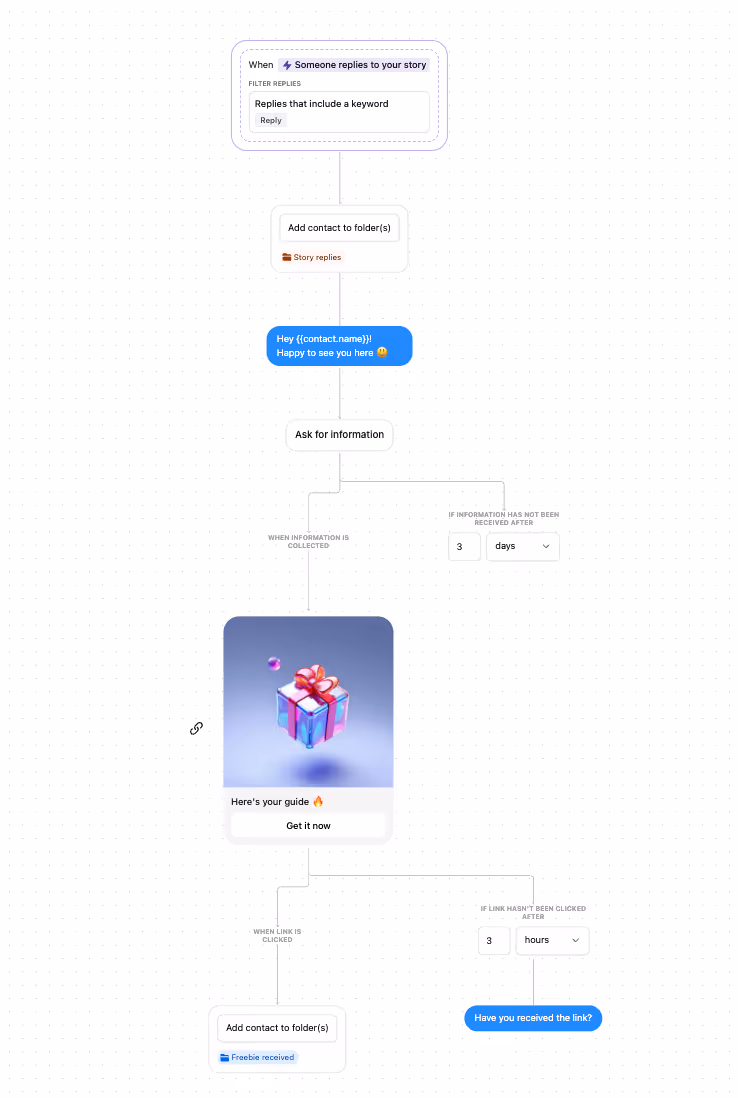
When a viewer replies to your Story, that opens a DM conversation. If you are running any kind of offer, freebie, or lead magnet, manually following up with every reply is not scalable. Tools like Inrō's Story reply automation let you set up an automatic DM response the moment someone replies to a specific Story, so you capture leads in real time without watching your inbox.
This turns your navigation data into a conversion loop: find the Stories that keep people watching, add a reply prompt, automate the DM follow-up.
Beyond Navigation, Instagram Insights offers:
Together with Navigation, these metrics give a complete picture of your Stories’ success.
Navigation metrics tell you how people move through your content. But if you want to turn Story engagement into conversations and conversions, that’s where Inrō comes in.
Use your best-performing Story slides to trigger automatic DM replies. Set it up in under 5 minutes.


It shows how viewers move through your Stories (forward, back, exits, next swipes).
Not always. Forward taps are normal, but too many suggest your Story isn’t engaging.
It usually means people liked your Story enough to rewatch it.
Next swipes are more negative because users skip to another account. Exits are sometimes natural.
Yes, by creating engaging hooks, using interactive stickers, and testing formats that keep people watching longer.
Forward taps in Instagram Insights means a viewer tapped to skip to your next Story slide without finishing the current one. A high number of forward taps on an early slide usually signals that the hook did not land quickly enough.
Navigation metrics in Instagram Insights apply specifically to Stories. For Reels, Instagram tracks plays, likes, comments, shares, and saves instead. Navigation is a Stories-only metric set.
Instagram does not publish benchmarks for navigation rates, and averages vary significantly by account size and content type. As a general signal: back taps above 5% of viewers per slide are positive, and next story swipes above 15% per slide suggest the content is not connecting with the audience.
Join automations strategies and Instagram Insights weekly
By entering your email address above and clicking Subcribe, you consent to receive marketing communications (such as newsletters, blog posts, event invitations and new product updates), and targeted advertising from Inrō from time to time. You can unsubscribe from our marketing emails at anytime by clinking on the "Unsubscribe" link at the bottom of our emails. For more information about how we process personal information and what right you have on this respect, please see our Privacy Policy.
Attract more leads, target them with DM marketing, and automate your interactions on Instagram!
.avif)
.avif)
.avif)